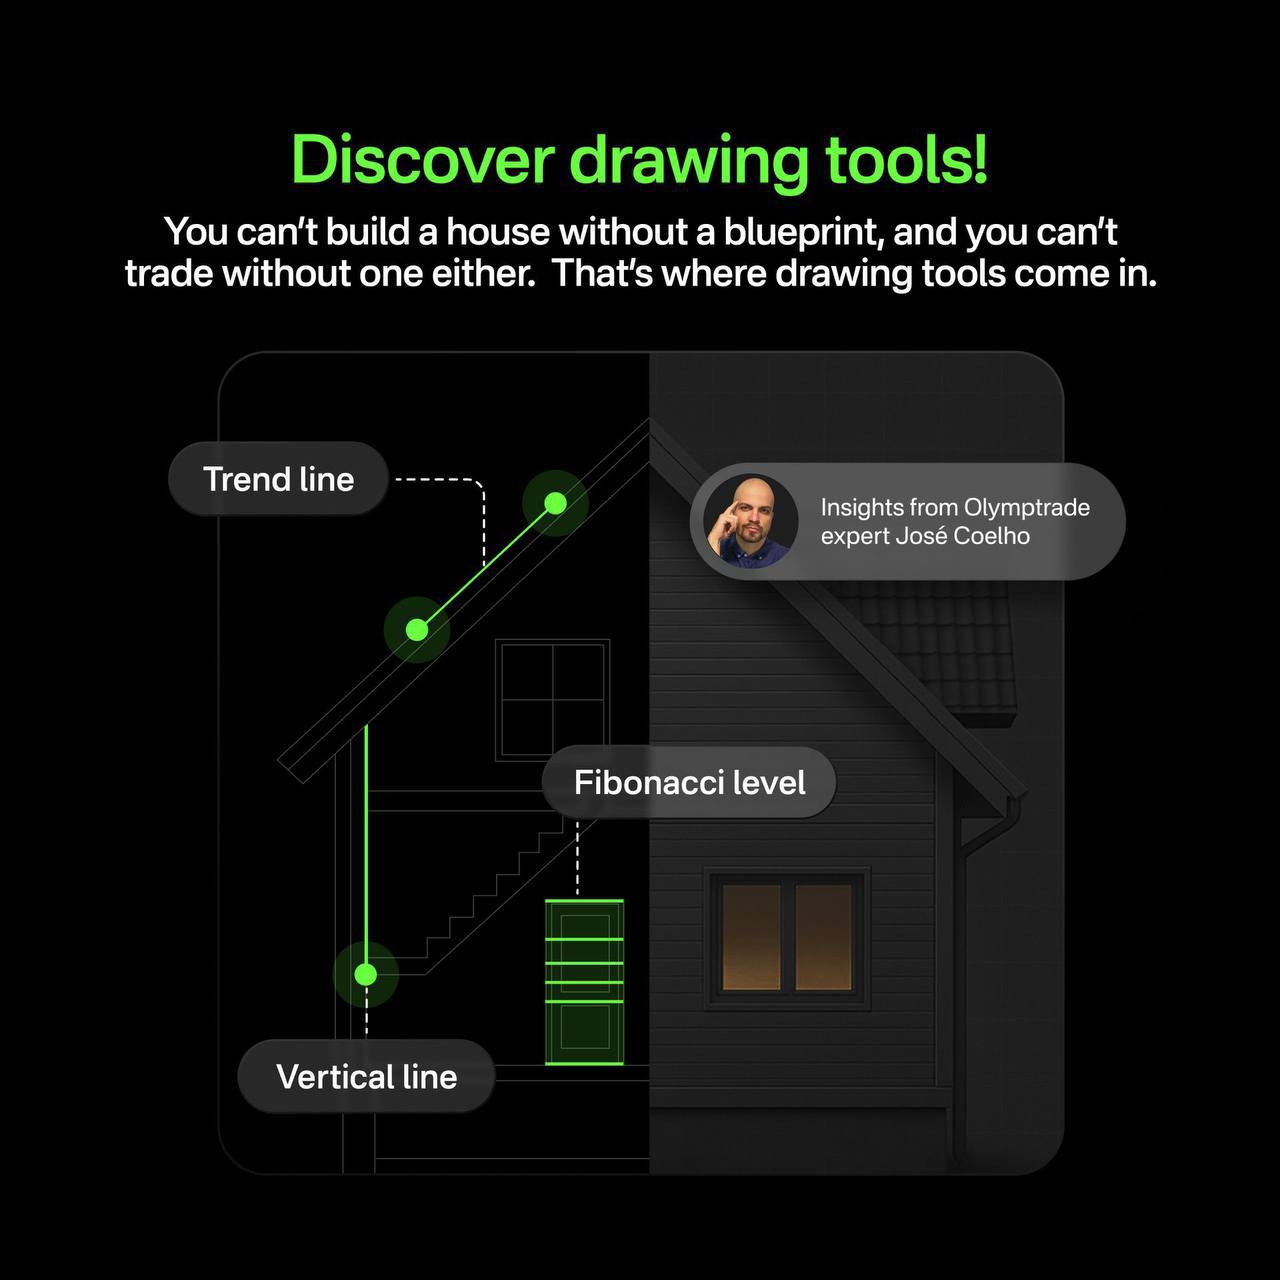





💁♂️ Just like every good architect sketches out the structure of the upcoming build, every savvy Olymptrader uses drawing tools to map out the market.
- Horizontal lines are like floors and ceilings, marking support and resistance zones where price often stops or bounces.
- Verical lines are like walls, representing major events like economic news or market reversals.
- Trend lines and rays shape the roof, showing the market’s direction — climbing up, sliding down or ready to break through.
- Fibonacci levels and fan act like doorways and windows — important spots where price may pause or change course.
How to get started:
✅ Draw the lines to mark price “walls”.
✅ Use trend lines and rays to see the market’s “roof”.
✅ Add Fibonacci tools to find key “openings” for possible price moves.
With this blueprint, you can build your trades smarter.
📉Link to register 👉 https://olymp.gl/BuOqg
✨ @olymptradersignal