📉 Средняя цена входа в биткоин-ETF превысила рыночную на фоне оттока $2,8 млрд.
Курс биткоина снизился до уровня ниже средней стоимости покупки американских спотовых биткоин-ETF. В ночь с 1 на 2 февраля 2025 года BTC опустился до $74 600, что стало минимальным значением за последние девять месяцев.
@AIRDROP HUNTER CIS
🌐 DAPP | YouTube | Telegram | X (twitter)
Участвуем в новом Launchpool ZAMA на Bybit 🔥
На https://partner.bybit.com/b/cryptosolyanka">Bybit стартовал ZAMA Launchpool, который будет актуален до 8 февраля 13:00 по МСК 🗓
Зарабатываем ZAMA, стейкая ZAMA или MNT. Всего раздадут 12,000,000 ZAMA 💰
3,000,000 ZAMA для холдеров ZAMA:
• Мин стейк: 2000 ZAMA
• Макс стейк: 100.000 ZAMA
9,000,000 ZAMA для холдеров ZAMA:
• Мин стейк: 60 MNT
• Макс стейк: 3,000 MNT
Как принять участие:
▪️Иметь аккаунт на https://partner.bybit.com/b/cryptosolyanka">Bybit и пройти KYC
▪️Зарегистрироваться на странице с лаунчпулом
▪️Подписываемся своими активами на пул
VIP-статус повышает лимиты и позволяет вложить в пул больше средств — от 50% до 166.66%.
🔝 Bybit: (все возможные скидки и бонусы для рефералов) https://partner.bybit.com/b/cryptosolyanka или реф. код 10312
Заносим свободные активы и забираем фри токены 💰
✍️ Роль для тестнета от Sphinx
💰 L1 с 2 🍋 инвеста
👨💻 Забираем роль, которая даст +4% к очкам их тестнета, который выйдет в первом квартале 2026.
🛞 Осталось 800+ мест ссылка
‼️ Список проектов на отработку 👉 ссылка 🚌 Тестнет от проекта Hotstuff 👉 ссылка
🛞 Последние активности 👉 1 / 2 / 3
✅ Дешевые мосты 👉 1 / 2 / 3
📱📱📱📱 Прокачиваем ссылка свои соц. сети.
🔔Скидки на биржи 👇
Скидки на биржи 👇
🔸Binance | 📈Bybit | KUKOIN | Bitget | HTX | Gate.IO | BingX | MEXC | 📈OKX
🗿 Главное в STON.fi за неделю
Стонфаеры! Ещё одна неделя успешных интеграций и укрепления протокола. Коротко рассказываем о том, что произошло.
1️⃣ Совсем скоро раскроем кое-что секретное. Интересно узнать, что там? Вход — через бота.
2️⃣ Запустили механизм пополнения казначейства. После принятия предложения в DAO команда STON.fi Dev разработала автоматизированный механизм, конвертирующий часть протокольных комиссий STON.fi в токены STON и GEMSTON для нужд бюджета DAO. Сейчас это решение работает в тестовом режиме, чтобы проверить все параметры перед полноценным запуском. Узнайте детали.
3️⃣ Функциональность STON.fi в Tonation. Обмены STONfi теперь встроены прямо в Tonation — некастодиальную донат-платформу для стримеров. Зрители совершают донаты в любом токене, который у них есть, авторы получают нужный актив, а STON.fi берёт на себя исполнение и маршрутизацию. Читайте подробнее.
Следите за обновлениями!
📊 APR в активных фермах:
🔥 TONG/TON → 176%
🔥 FRT/TON → 88%
🔥 STON/USD₮ → 16%
👉 Ещё больше ферм на STON.fi
📊 Статистика DEX:
🔥 Объём обменов за неделю: 14,3 млн TON ($19,2 млн)
🔥 TVL: 26,5 млн TON ($35,6 млн)
🔥 За неделю наши поставщики ликвидности получили около 25 821 TON ($34 601)
DEX | Telegram DEX | Онбординг | Гайды | Блог | Все ссылки
🐣 X 🤖 Discord 🌐 Reddit 🌐 LinkedIn 📹 YouTube 📷 Instagram 🪨 Клуб стонфаеров
🤑 😎😎😎 Ваши торговые идеи — это валюта! Зарабатывайте до 1000 USDT в неделю с ByX IMPACT
Мы обновили лидерборд IMPACT, чтобы вознаграждать авторов, чей контент помогает другим принимать торговые решения. С сегодняшнего дня (2 февраля 2026 года) ваши посты могут приносить вам долю из еженедельного пула 8 000 USDT!
📈 Как это работает?
- Публикуйте свои анализы рынка в ByX, добавляя теги монет и торговые виджеты.
- Зарабатывайте баллы IMPACT, когда пользователи торгуют напрямую через ваш пост.
- Поднимайтесь в рейтинге и забирайте награды в USDT каждый понедельник.
🏆 Еженедельный призовой фонд: 8 000 USDT
🛠 С чего начать?
- Убедитесь, что у вас пройдена верификация (Ур. 1) и чистый депозит от 100 USDT.
- Установите имя и аватар в профиле ByX.
- Нажмите «Участвовать» на странице промоакции.
🚀 Будьте в числе первых — обновите приложение и подайте заявку на ранний доступ уже сегодня!
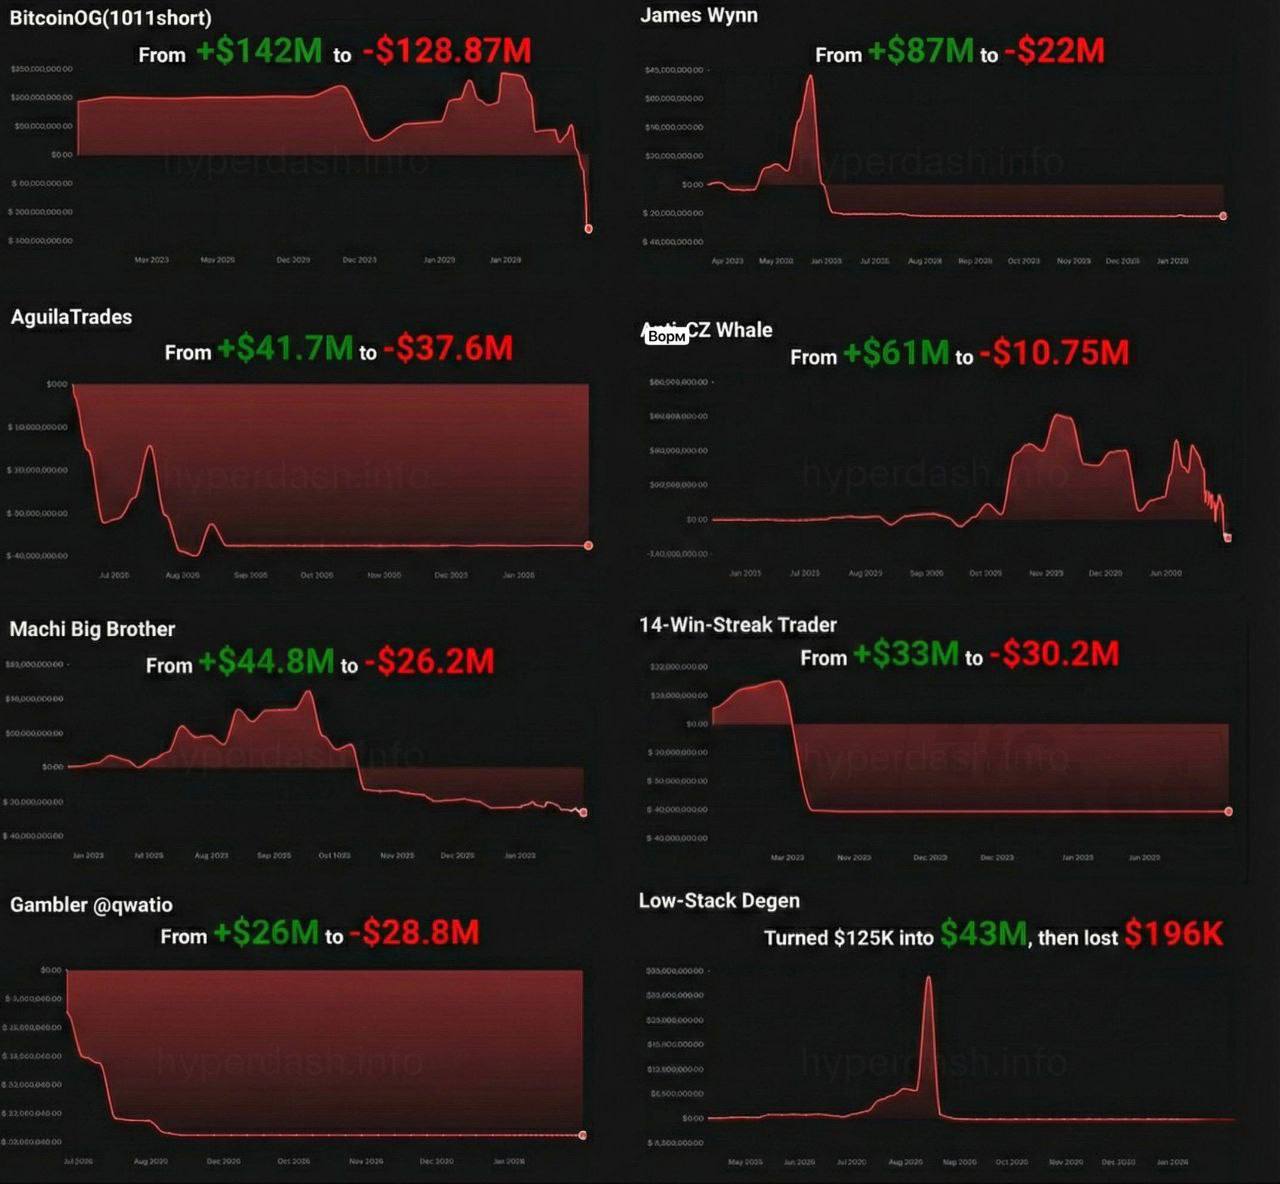
😵 Все 8 известных трейдеров которые получили колоссальную прибыль, были ликвидированы всего за сутки:
🌽 Бета-фаза Nado: 950k поинтов в неделю
Мы уже фармили Nado в Private Alpha — и ранние активные участники получили награды: все, кто сделал объём $400k+ в Alpha, получили NFT Templars of the Storm, который можно было продать примерно за $1.2k–1.5k.
🟡 Польза NFT
💬 Множители поинтов в будущих кампаниях
💬 Автоматические уровни комиссий на Nado
💬 Дополнительный сигнал для будущего аирдропа (очень вероятно — часть критериев)
Теперь команда запускает Season 1 бета-фазы с недельным пулом в 950 000 поинтов.
🟡 Кто зарабатывает поинты каждую неделю
💬 Трейдеры
💬 NLP-депозиторы
💬 Рефералы
📆 Снимок — каждый четверг
💸 Распределение поинтов — каждую пятницу
Уже распределено:
💬 6 915 074 поинта — Private Alpha
💬 2 000 000 поинтов — предыдущие 2 недели
💬 80 000 поинтов — за фидбек и баг-репорты
В новом сезоне Nado планирует добавить FX, RWA, Builders Codes и другие фичи поверх perp-движка.
Если вы уже в Nado — имеет смысл наращивать объёмы, LP-депозиты и рефералов в бете.
Если вы всё ещё в стороне — это чистый «второй заход» после Alpha, которая уже доказала: серьёзная активность приносит серьёзные награды🌽
📉 Драгметаллы теряют триллионы, а биткоин вылетел из топ-10 крупнейших мировых активов
За последние сутки золото и серебро суммарно потеряли около $1,66 трлн капитализации.
На этом фоне биткоин впервые за долгое время покинул топ-10 крупнейших мировых активов по капитализации, опустившись на 13-е место.
Как выглядит топ сейчас:
1) Золото — $31,6 трлн
2) Nvidia — $4,65 трлн
3) Серебро — $4,12 трлн
4) Alphabet (Google) — $4,08 трлн
5) Apple — $3,81 трлн
…
13) Биткоин — $1,53 трлн
Еще до недавнего времени первая криптовалюта находилась в топ-5.
Tokensales | News | Incrypted+
#НовостиВыходных
📊 Трамп избрал Кевина Уорша новым председателем ФРС.
📊 Майкл Сэйлор: Кевин Уорш станет первым председателем ФРС, поддерживающим BTC.
🔼 Tether в 2025 году заработал более $10 млрд, что является рекордом.
🔽 Из-за падения рынка криптовалют, компания Strategy Майкла Сэйлора вышла в убыток по своей позиции в BTC.
🔽 BBG: Падение BTC ниже отметки $80 000 сигнализирует о новом кризисе доверия. Все меньше трейдеров ожидают, что BTC побьет рекорды в этом году.
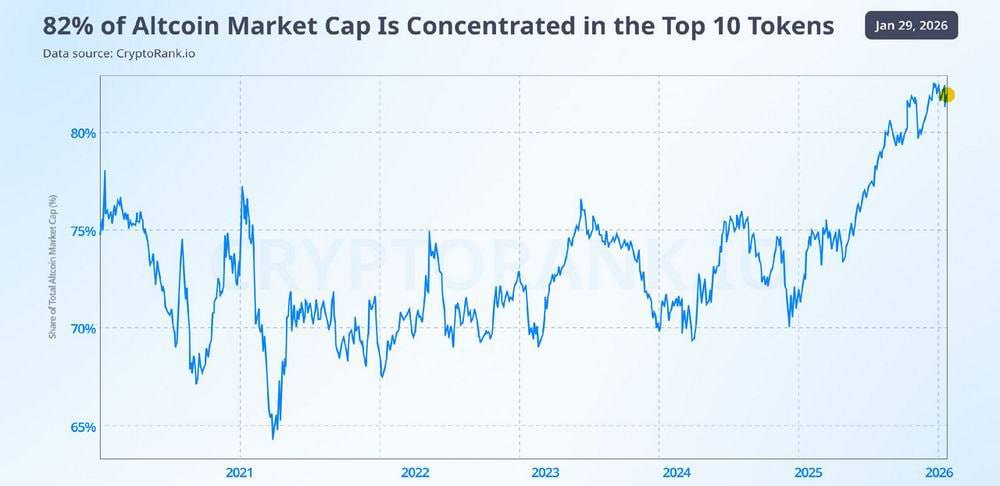
📊 Cryptorank: на долю 10 крупнейших альткоинов приходится около 82% общей рыночной капитализации рынка альткоинов.
☝️ Чат для общения
MDAO Maker | Распределение токенов FUEL⬇️
Мы отправили очередную партию токенов FUEL на ваши кошельки!
✅ 30 января 2024 — 5% токенов FUEL
✅ 8 марта 2025 — 5%
✅ 31 марта 2025 — 3.5%
✅ 15 мая 2025 — 3.5%
✅ 26 мая 2025 — 4%
✅ 30 июня 2025 — 4%
✅ 27 июля 2025 — 4%
✅ 29 августа 2025 — 5%
✅ 29 сентября 2025 — 4%
✅ 31 октября 2025 — 5%
✅ 4 декабря 2025 — 4%
✅ 9 января 2026 — 5%
🆕 2 февраля 2026 — 4%
📌 О ТОКЕНЕ FUEL:
• TGE: сеть Ethereum
• Листинг на множестве криптобирж, включая:
🔶 Binance | FUEL/USDT
📈 Bybit | FUEL/USDT
✖️ BingX | FUEL/USDT
📈 MEXC | FUEL/USDT
🪙 Gate.io | FUEL/USDT
📈 Bitmart | FUEL/USDT
⚠️ Обратите внимание:
Не забудьте пополнить баланс ETH на вашем кошельке, чтобы оплатить комиссию сети при переводе токенов на биржу или другой кошелек. Мы рекомендуем иметь на кошельке от 0,00005 ETH при текущей цене на газ для корректного выполнения транзакций.
Поздравляем сообщество с новым распределением токенов от платформы MDAO Maker!
👛 ASTRA WALLET
📊 MDAO Maker
#mdaomaker #fuelnetwork
🎆 Доброе утро
Bitcoin ETF: -$510 млн. (30.01)
Ethereum ETF: -$253 млн. (30.01)
Solana ETF: -$11 млн. (30.01)
Индекс альтсезона: 29/100
Капитализация рынка: $2.53 трлн.
Доминация BTC: 59.4%
До ATH BTC осталось: $50,891
За сутки ликвидировано позиций на $695 млн.
Топ рост: SOLVBTCBBN (+40.8%), ULTIMA (+17.1%)
Топ падение: H (-18.2%), SENT (-13.0%)
👍 — Пожелайте друг другу продуктивного дня
Запуск Beta-Phase в Nado
Про Nado мы уже вам рассказывали и освещали участие в Alpha-фазе. Так вот, те, кто начал отработку проекта, получили приятный бонус за свою активность.
Участники в Alpha-фазе сделавшие свыше $400к торгового оборота были вознаграждены NFT Templars of the Storm, которые вполне можно было слить за $1.2к-$1.5к.
*️⃣ Привелегии за NFT:
• Множители поинтов;
• Автоматические уровни комиссий.
Ряд других ютилити должны появятся позже, да и сама NFT может послужить дополнительным критерием под будущий дроп.
Сейчас же команда открывает первый сезон Beta-фазы, в которой каждую неделю участники будут делить пул в 950.000 поинтов.
🔤На данную еженедельную раздачу смогут претендовать:
• Трейдеры;
• NLP-депозиторы;
• Рефоводы.
Снепшот будут делать каждый четверг, а распределение поинтов будет по пятницам.
• Поинты за Private Alpha — 6.915.074
• Поинты за предыдущие 2 недели — 2.000.000
• Поинты за фидбек и баг-репорты — 80.000
В новом сезоне обещают ввести несколько новых опций, таких как FX, RWA, Builders Codes и другие фичи.
IDO research | Chat | NFD
Ребята, все живы, надеюсь? У меня грамотная аудитория, которая знает, что такое РМ и ММ.
Ну а теперь, посмотрим рынок.
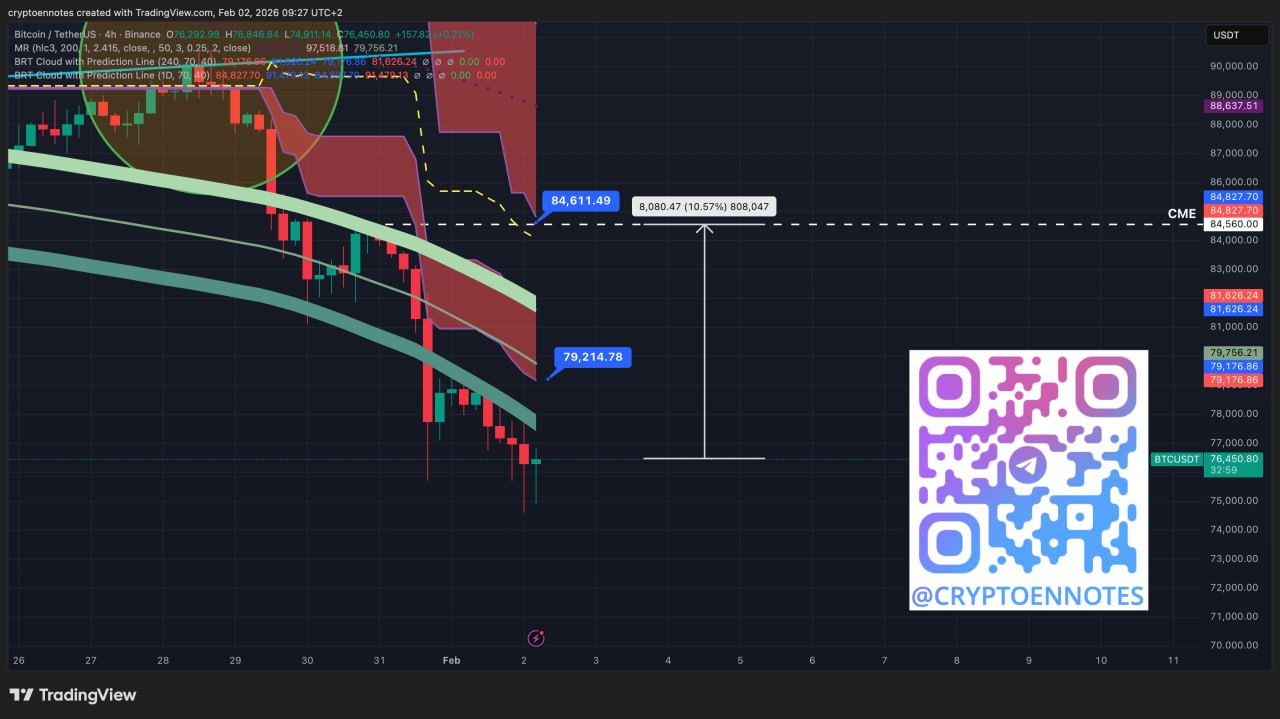
#BTC
1️⃣ На 4ч красивые пин-бары;
Бычий пин-бар — это свечной паттерн, который указывает на возможное разворот рынка вверх. Он имеет небольшое тело, длинную нижнюю тень и короткую верхнюю тень, что говорит о том, что медвежье давление было отброшено и покупатели перехватили инициативу.
2️⃣ Сверху, на отметке 79 214$ тест облака на 4ч;
Облако Ишимоку — это комплексный технический индикатор, который одновременно показывает тренд, уровни поддержки/сопротивления и потенциальные торговые сигналы. Создан Гоичи Хосодой.
3️⃣ Сверху, на отметке 84 611$ тест облака на 1д, и уровень закрытия по СМЕ;
Чикагская товарная биржа (англ. Chicago Mercantile Exchange, СМЕ) — одна из крупнейших и наиболее диверсифицированная товарно-сырьевая биржа мира. Располагается в Чикаго, США.
4️⃣ Гэп на данный момент уже составляет более 10%. На пике было аж 13,2%;
Гэп (gap) — это разрыв на ценовом графике, означающий существенное отличие между ценой закрытия предыдущего периода и ценой открытия следующего, возникающее из-за новостей или событий, пока рынок был закрыт, связанным с английским словом "gap" (промежуток, пробел).
Не переживайте, всё будет хорошо, хоть глобальный тренд и медвежий.
КАНАЛ | ЧАТ | БОТ-АССИСТЕНТ | ОБУЧЕНИЕ
АЛГОТРЕЙДИНГ FIREDRAKE.APP
🗣Cryptorank: сегодня на долю 10 крупнейших альткоинов приходится около 82% общей рыночной капитализации рынка альткоинов.
Крупнейший российский майнер BitRiver в глубоком кризисе, близок к банкротству.
27 января 2026 введена процедура наблюдения в отношении ООО «ГК "Фокс"» (контролирует почти всю УК BitRiver) по иску структуры En+ («Инфраструктура Сибири») — долг >700 млн руб. + штрафы за непоставленное оборудование.
Основатель Игорь Рунец задержан 30–31 января 2026 по делу о сокрытии средств / уклонении от налогов → под домашним арестом (решение Замоскворецкого суда Москвы).
Аресты счетов, многомиллионные иски от En+, энергокомпаний, Норникеля;
Региональные запреты майнинга → закрыты/не запущены крупные площадки (Иркутск, Ингушетия, Бурятия); отток 80% топ-менеджеров, задержки зарплат, закрытие офисов.
Идут переговоры о смене собственника и передаче активов.
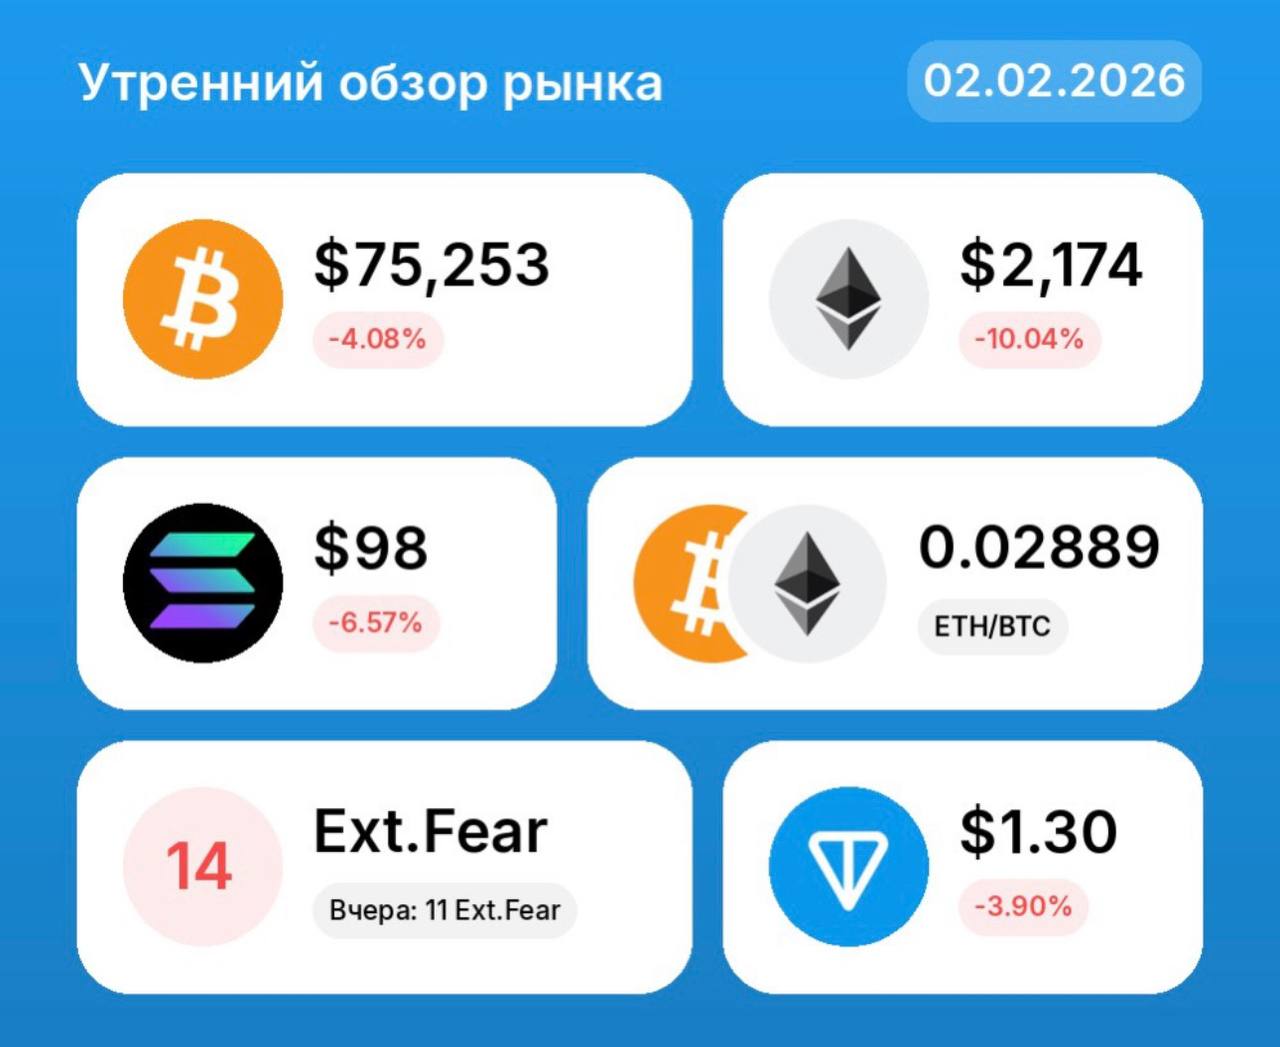
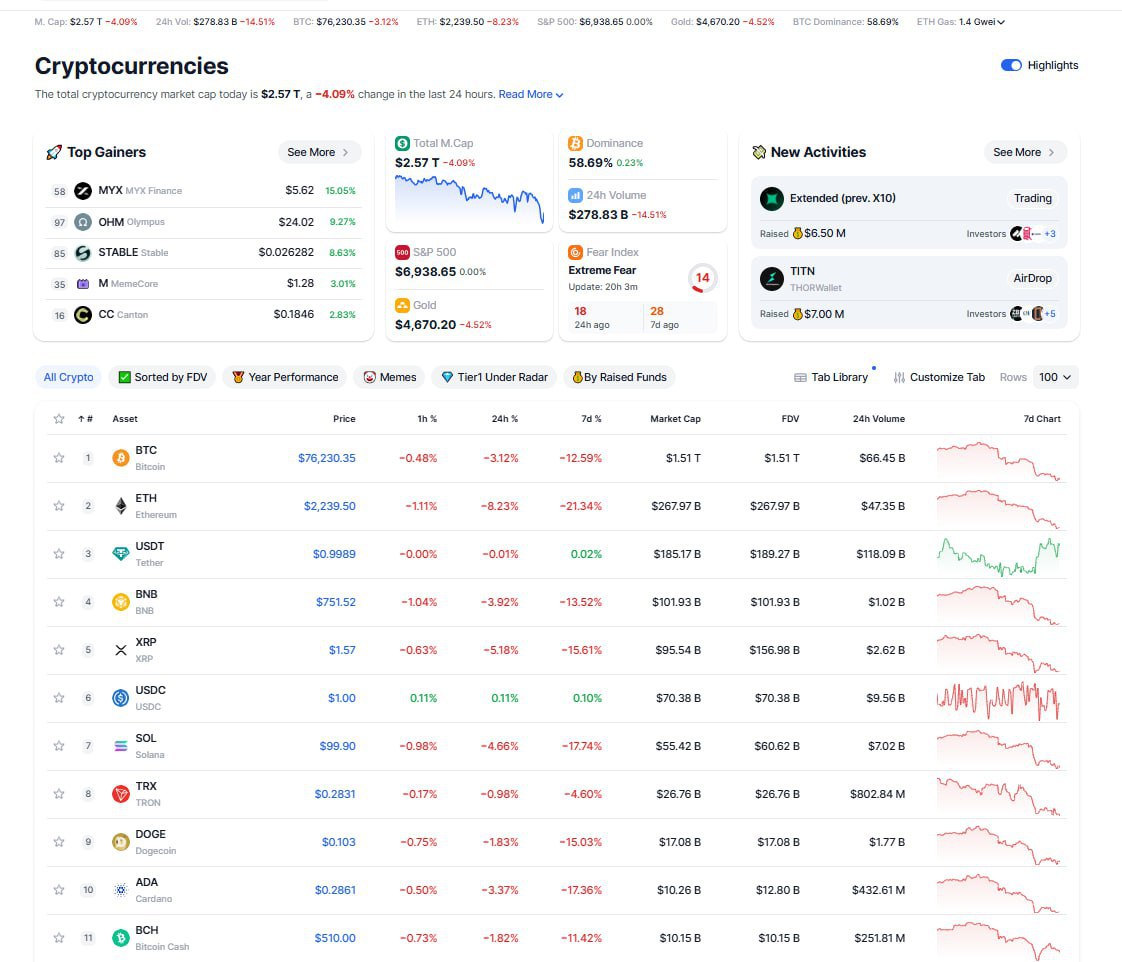
Рынок падает
Доминация BTC - 58,89%
Market Cap - 2,57 трлн. долларов
BTC - $76230 (-3,12%)
ETH - $2239 (-8,23%)
BNB - $751 (-3,92%)
SOL - $99 (-4,66%)
NYX - $5,62 (+15,05%)
📉 Биткоин не смог продемонстрировать рост на фоне резкого скачка цен на золото и серебро.
Трейдеры фиксируют внимание на уровне заявок около $87,500 и постоянном давлении на продажу под отметкой $90,000. Это создает ситуацию, напоминающую перетягивание каната в конце месяца.
@PROBLOCKCHAIN SQUAD


