В комментариях был
задан вопрос: как именно по шагам использовать все индикаторы, которые упоминаются в этом канале?
➡️ Простой ответ: их не надо учитывать все вместе, следует ориентироваться на ситуацию.
➡️ Полный ответ: успешная торговля не алгоритмизируема на низовом уровне. Иначе можно было бы настроить бота и вообще не открывать терминал.
▫️Рынок, во-первых, динамичен и подстраивается под эффективные стратегии таким образом, чтобы они становились неэффективными (это естественный процесс, так как в этой среде чей-то заработок — это чей-то убыток, соответственно, система постоянно изменяется по законам эволюции). Во-вторых, в разных фазах работают разные подходы. В-третьих, периодически возникают обстоятельства непреодолимой силы, которые полностью ломают систему (например, обстрел Ираном Израиля в апреле 2024
уронил многие токены ниже всех разумных уровней поддержки).
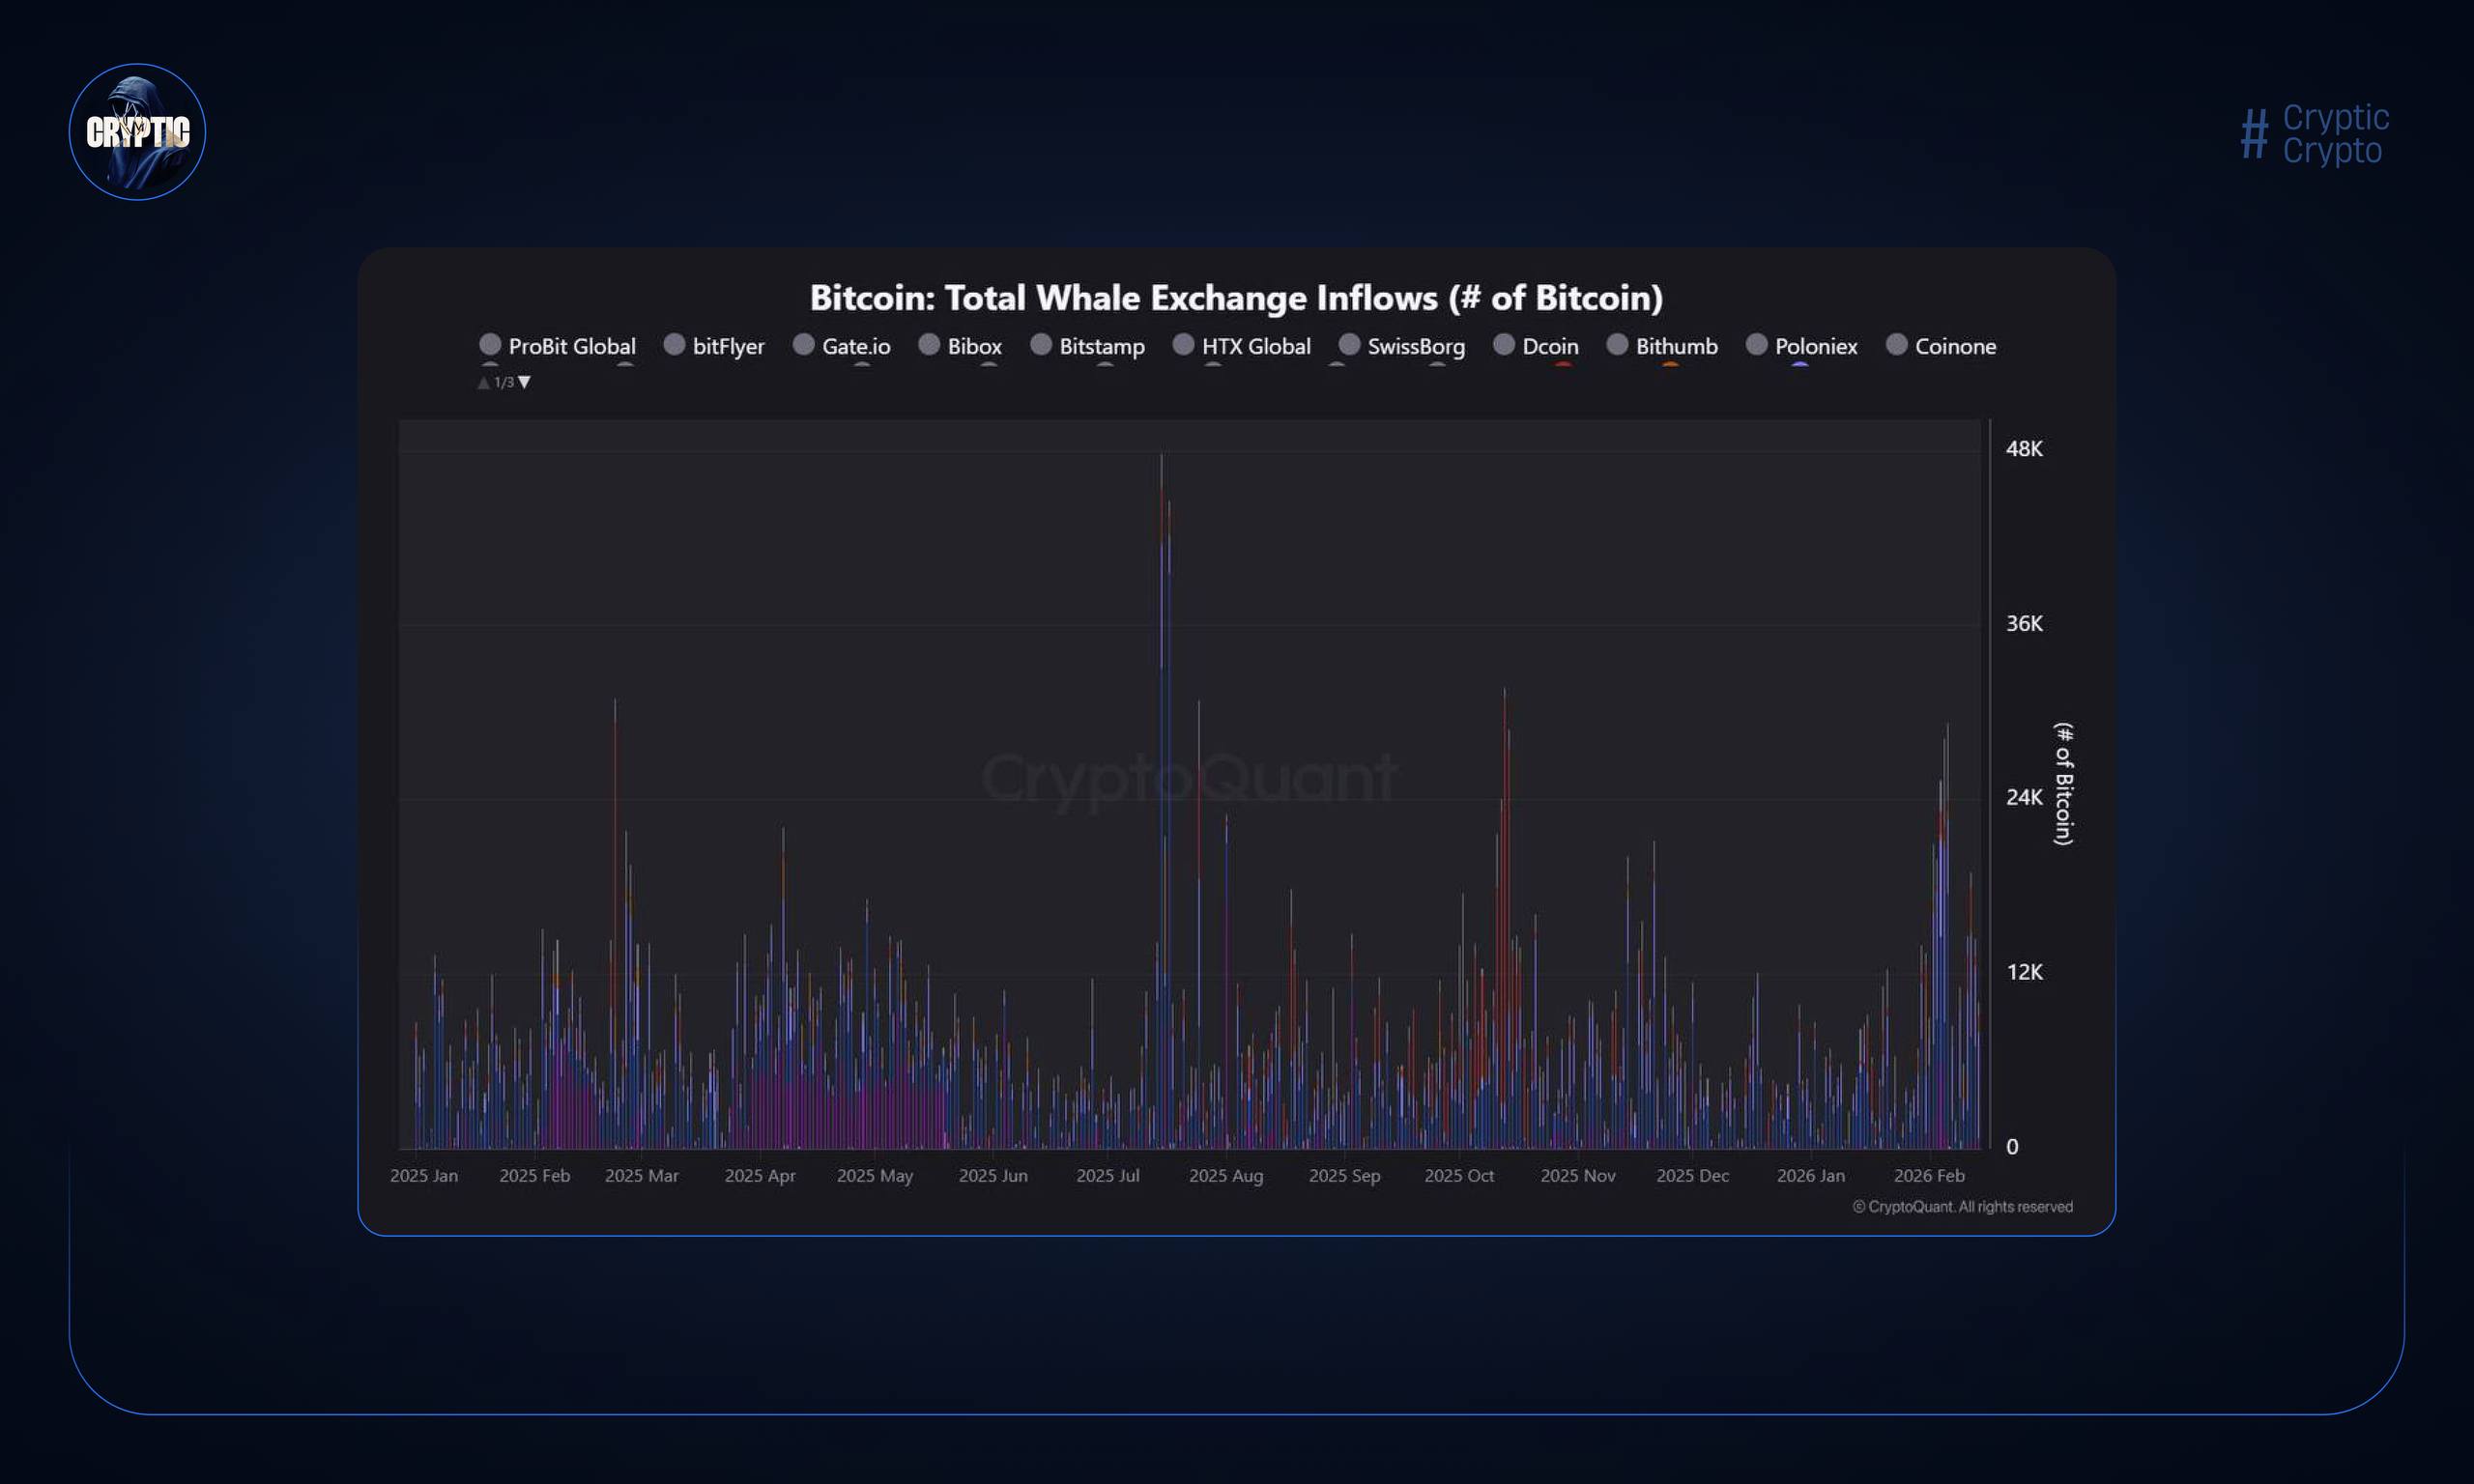
➕Главная цель трейдера — натренировать свой мозг таким образом, чтобы он сам понимал, какие индикаторы ему важно сейчас учитывать. Глядя на простой график, где нет ничего, кроме цены и объёма, вы должны почувствовать необходимость в каком-то индикаторе. Для этого у вас должен быть опыт работы в разных ситуациях с разными инструментами.
✅Таким образом, ключ к успеху — это опыт. Он подскажет вам, что именно нужно добавить на график или посмотреть в отдельном сервисе в каждой конкретной ситуации.
▫️В комментариях
упоминался известный гуру Питер Брандт (начинал с товарных фьючерсов в 1975, сейчас торгует в т. ч. криптой), который считает, что успешным трейдер может стать только после 10 лет торговли. При этом сам Брандт использует преимущественно базовые инструменты теханализа (его любимая книга: Technical Analysis of Stock Trends, первое издание которой вышло в 1948 году). Он также говорит, что в начале карьеры ему просто повезло, поэтому он не бросил это дело спустя первые годы, полагая, что имеет талант. А когда осознал суровую реальность трейдинга, был уже достаточно опытным, чтобы преодолеть «черную полосу», с которой любой трейдер обязательно столкнется.
▫️На крипторынке все процессы происходят очень быстро. 10 лет не обязательны. Очень полезно пережить хотя бы один большой цикл роста и падения. Условно, если вы торговали в ковидный памп и последующий дамп (2021-2023), у вас сейчас должно быть достаточно опыта. Это само по себе не гарантирует успех, так как не всем дано заниматься этой деятельностью. Так же как не все могут стать программистами, музыкантами, врачами и пилотами. Вполне может быть, что трейдинг вам не подходит. В этом случае можно вздохнуть с облегчением и перейти к простому
HODL, подбирая тот же биток на просадках.
➡️ Итого: изучайте разные подходы, не зацикливайтесь на чем-то одном. Следите за рынком, пробуйте. Постепенно вы либо определитесь с тем, какие инструменты вам лучше всего подходят, либо поймете, что вам неинтересно этим заниматься. Несколько лет анализа в любом случае необходимы. И, кстати, даже если вам не подойдет эта деятельность, она полезна для мозга (снижает риск возрастных нейродегенеративных заболеваний — главное только сильно не нервничать, чему, кстати, тоже можно научиться на рынке, грамотно работая с рисками). Усилия точно не будут потрачены впустую.
➡️ Среди читателей есть много опытных трейдеров (которые, кстати, часто делятся в чате очень полезными сетапами). Текст, естественно, обращен не к ним.
P.S. Сегодня очень красивая Луна. Фото сделано с места, где написана бóльшая часть статьи в ожидании ужина.