📈 Что такое трендовая торговля?
Трендовая торговля — это одна из ключевых стратегий алгоритмической торговли, основанная на следовании за трендами рынка. В её основе лежит принцип, что активы, движущиеся в одном направлении, имеют тенденцию продолжать это движение.
📈 Как это работает
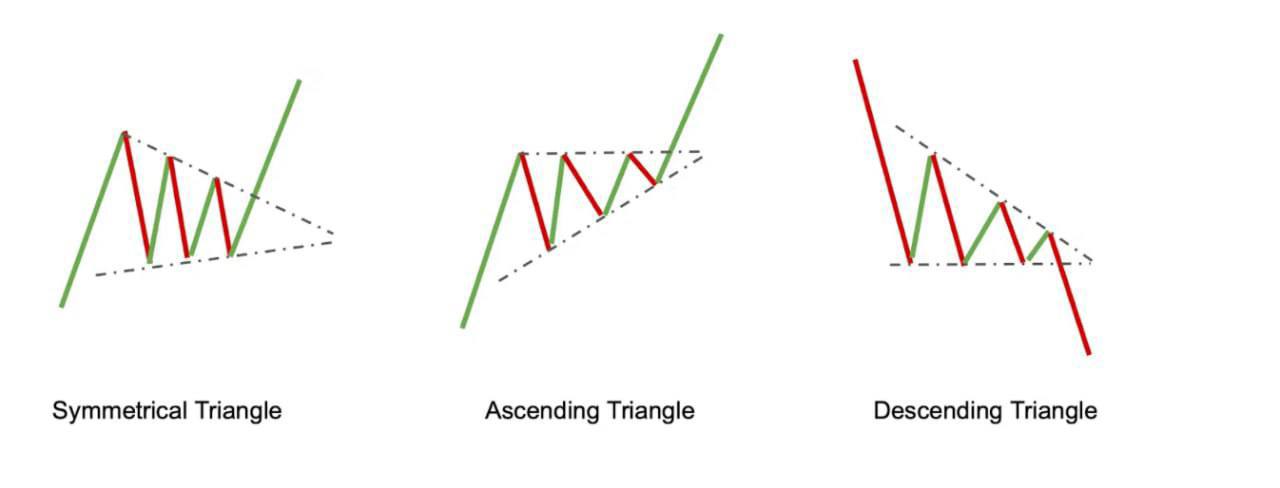
В техническом анализе тренд — это устойчивое направление движения цены актива, которое можно разделить на два типа: бычий (восходящий) и медвежий (нисходящий).
🐂 Бычий тренд (bullish trend):
Цена актива растет, достигая новых максимумов, а каждый откат остается выше предыдущего. Алгоритм отслеживает эти сигналы и открывает long-позицию (покупка актива), ожидая продолжения роста.
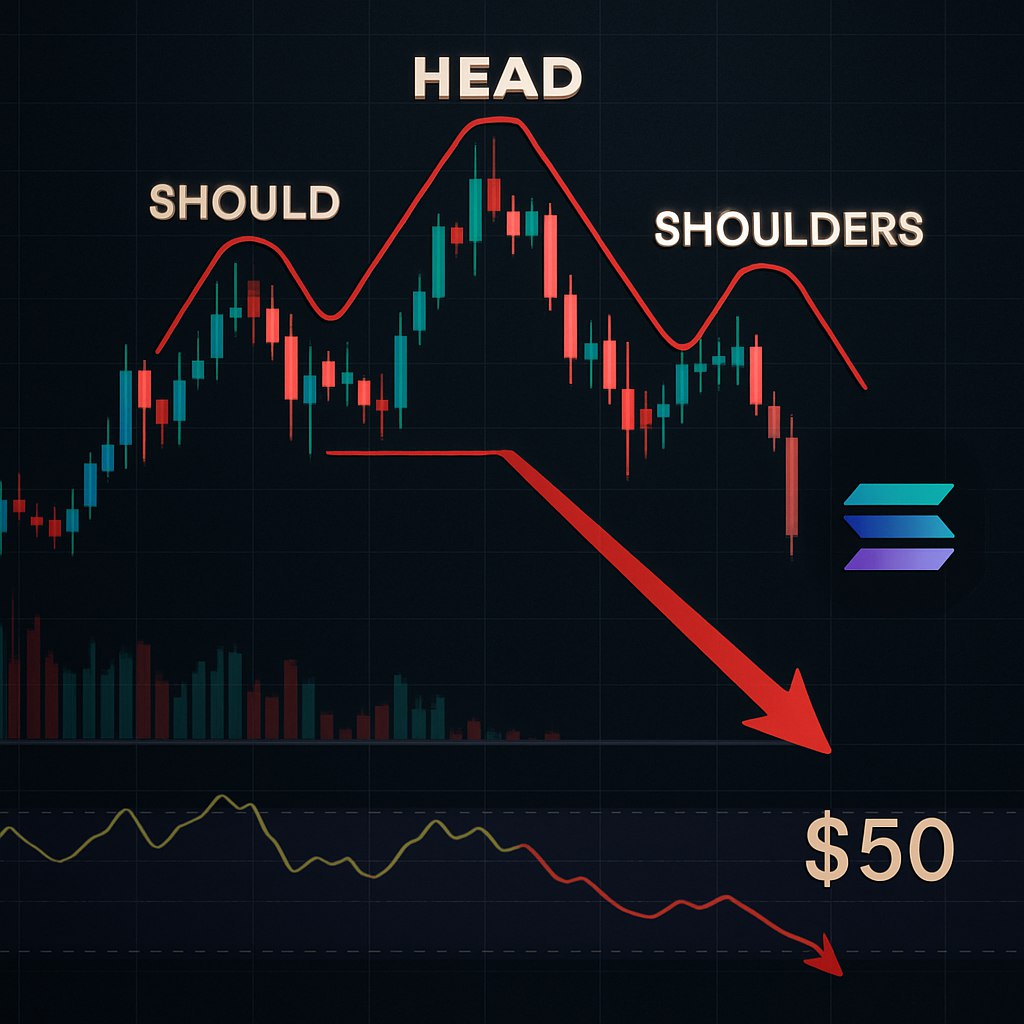
🐻 Медвежий тренд (bearish trend):
Цена актива снижается, при этом каждый откат не превышает предыдущих минимумов. Алгоритм открывает short-позицию (продажа актива), ожидая продолжения падения.
📊 Почему это выгодно
Трендовая торговля - это стратегия, основанная на нескольких принципах:
📈 Следование за трендом: Рыночные активы часто движутся в одном направлении, и задача трейдера - максимально использовать эти движения.
⚙️ Автоматизация: Алгоритмы быстро распознают тренды и открывают сделки, что минимизирует влияние человеческого фактора и повышает точность.
⚠️ Управление рисками: Алгоритмы чётко следят за трендом и могут оперативно закрыть позиции, если тренд начинает меняться, минимизируя возможные убытки.
📊 Как это применяется на практике
На реальных рынках тренды могут продолжаться долго. Например, в период сильных медвежьих или бычьих трендов, алгоритм может извлекать прибыль не только от долгосрочных движений, но и от краткосрочных колебаний, что позволяет зарабатывать на флуктуациях цен.
📌 Вывод
Трендовая торговля позволяет не только следить за движениями рынка, но и использовать математически обоснованные методы для принятия торговых решений. Применение таких стратегий на высоко волатильных рынках, например, в криптовалюте или акциях технологических компаний, приносит стабильный результат.
👉 Присоединяйтесь к алгоритмической AI стратегии инвестирование через @Makarov_SharesPro или наше приложение:
📱 AppStore
📱 GooglePlay
🌐 SharesPro